Frank Xu

Obtaining insights from data/events for business and environmental health services
Ph.D. cadidate in Spatial Information Science and Engineering;
Ph.D. in Molecular Genetics & Biotechnology
View My LinkedIn Profile
Optimization of machine learning techniques for stock price prediction
Project description: Optimization of machine learning and deep learning approaches for predicting stock prices for a selected company. My assumption is that the fluctuation patterns of stock prices vary between companies. Many existing machine learning/deep learning approaches can be applied to a time series data set of stock prices from a specific company with most probably different prediction accuracy and precision. Even the same approach is used if the feature selections or methods of feature engineering are different, and the results would also vary. This project will use a series of machine/deep learning approaches to analyze historic datasets of some selected stocks and choose a best combination of an algorithm, feature selection method, and similarity/distance measure for a specific company’s stock.
1. Importing the basic libraries and reading the data from the CSV file
import numpy as np
import pandas as pd
import matplotlib.pyplot as plt
%matplotlib inline
stock_data = pd.read_csv("amzn2014-2019.csv")
2. Converting all data elements to numeric or datetime
stock_data['date'] = pd.to_datetime(stock_data['date'], format = '%m/%d/%Y')
stock_data['close'] = pd.to_numeric(stock_data['close'], errors='coerce')
stock_data['volume'] = pd.to_numeric(stock_data['volume'], errors='coerce')
stock_data['open'] = pd.to_numeric(stock_data['open'], errors='coerce')
stock_data['high'] = pd.to_numeric(stock_data['high'], errors='coerce')
stock_data['low'] = pd.to_numeric(stock_data['low'], errors='coerce')
3. Day average of stock price and volume of the traded stocks as input
# Take the average of the low and high of the AMZN stock for the day and the volume of the stocks traded for the day
# as inputs to predict the stock prices.
import math
stock_data["average"] = stock_data.apply(lambda row: (int(row.high) + int(row.low))/2, axis=1)
input_feature= stock_data.iloc[:,[2,6]].values # become array type of data
input_data = input_feature
4. The first plot for the traded volume for the day
# plot the data for volume for the Amazon stocks (AMZN) traded for the day
plt.plot(input_data[:,0])
plt.title("Volume of stocks sold")
plt.xlabel("Time (most current-> oldest) (5/6/2019-5/6/2014)")
plt.ylabel("Volume of stocks traded")
plt.show()
The first plot on volume for the AMZN stocks traded for the day

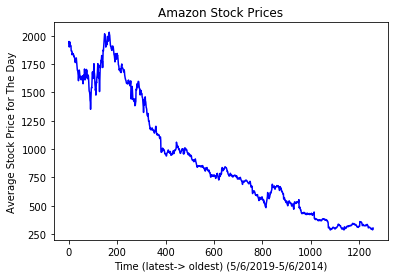
5. The second plot for the average day stock price
# plot the data for the average price for the day the Amazon stock
plt.plot(input_data[:,1], color='blue')
plt.title("Amazon Stock Prices")
plt.xlabel("Time (latest-> oldest) (5/6/2019-5/6/2014)")
plt.ylabel("Average Stock Price for The Day")
plt.show()
The second plot on the AMZN average day stock price

For more details see GitHub Flavored Markdown.